Achieving Success in Investment with Technical Analysis
Technical analysis is one of the most effective methods used to understand price movements and predict potential future trends when investing in the stock market. Analyzing market trends with the help of charts, indicators, and formations helps you make investment decisions more consciously. By learning technical analysis methods, you can better understand market movements, make timely buy-sell decisions, and manage your risks more effectively. A technical analysis strategy supported by knowledge and experience enables you to achieve success in investing.
Technical Analysis Courses
What is Technical Analysis?
Technical analysis is a method used to examine the price movements of assets such as stocks, cryptocurrencies, currencies, or commodities in financial markets and to predict future trends. In technical analysis, data such as past price movements and trading volume are examined, and analysis is performed on charts. The basis of this method lies in making predictions about how prices will behave in the future based on past movements.
How is Technical Analysis Done?
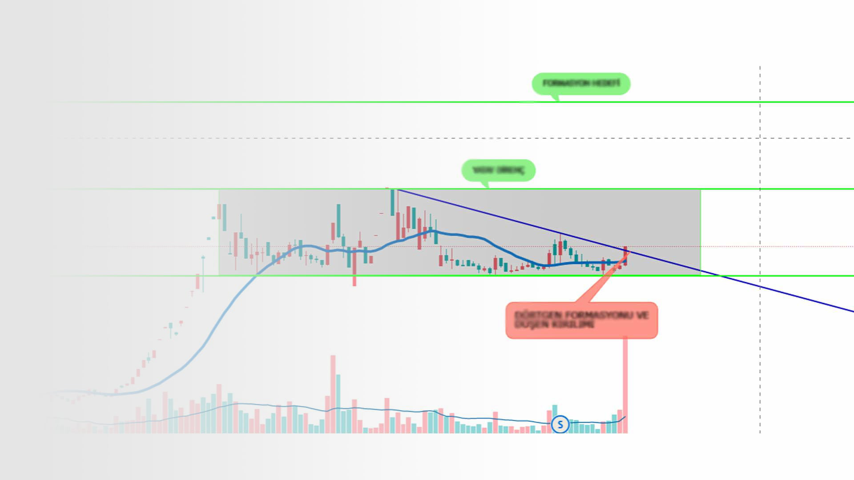
When conducting technical analysis, specific formations and indicators are used by examining price charts. Among the most commonly used tools to answer the question How is technical analysis done in the stock market? are indicators such as moving averages, support and resistance levels, RSI, MACD, and Fibonacci retracement levels. Additionally, with technical analysis courses, investors can learn how to use these indicators and better understand market trends.
What to Pay Attention to When Performing Technical Analysis?
To achieve success in technical analysis, it is important to use the right tools. Here are the key points to consider:
1. Choosing Chart Periods
In technical analysis, investors make buy-sell decisions using different periods. The chosen time frame varies depending on the investor's strategy:
-
Short-Term Trades: These types of trades generally conclude within a few minutes or hours, and short-term charts are used. For example, 5-minute, 15-minute, or hourly charts are ideal for short-term investors. In short-term strategies, indicators sensitive to immediate price movements are preferred, and volatility can be high.
-
Medium-Term Trades: For intraday (day-trade) or several-day positions, 4-hour or daily charts are used. In this strategy, price trends are expected to be more pronounced, and the likelihood of trend reversals is given more consideration.
-
Long-Term Trades: Weekly and monthly charts are preferred for long-term investors. Investors generally focus on major macroeconomic developments and long-term market trends. The answer to the question How is stock technical analysis done? is supported by different analysis techniques in the long term. In the long term, tracking larger trends provides investors with an advantage in predicting overall market movements.
Each investor should choose an appropriate time frame according to their goals and risk tolerance.
2. Proper Use of Indicators
The indicators used in technical analysis play a critical role in interpreting price movements and trends. However, not every indicator may be valid in every situation. To use indicators effectively, the investor must select those appropriate for the strategy and correctly interpret the signals from these indicators:
- Moving Averages (MA): One of the most popular indicators used to track price trends. There are different types, including simple (SMA) and exponential (EMA). Longer periods (50-day, 200-day) are used for long-term trades, while shorter periods (5, 10, 20-day) are preferred for short-term trades.
- RSI (Relative Strength Index): An oscillator that indicates overbought or oversold conditions. When the RSI value exceeds 70, it signals overbought conditions; when it falls below 30, it signals oversold conditions. However, it can be misleading when used alone; therefore, it is recommended to be evaluated in conjunction with other indicators.
- MACD (Moving Average Convergence Divergence): Used to analyze trend changes. MACD signals are particularly useful for capturing trend reversals.
- Fibonacci Retracement Levels: Investors use these to predict levels at which prices may react during declines or increases.
To use these indicators effectively, receiving proper training is critical. Knowing when and how to use each indicator will help you avoid mistakes.
3. Psychology and Discipline
One of the biggest challenges investors face when implementing technical analysis strategies is staying true to analysis-based strategies without making emotional decisions. Especially during periods of high market volatility, emotional decisions can lead investors to losses. Therefore, psychology and discipline are fundamental elements of the investment process:
- Patience and Composure: It is essential to be patient and wait for prices to reach the levels you target when prices are fluctuating in the market. Emotional reactions such as quick profit-taking or panic selling should be avoided.
- Limiting Losses (Stop-Loss): One of the most important aspects of technical analysis is being able to minimize losses. Setting a stop-loss level for each investment transaction prevents emotional decisions and protects capital.
- Sticking to Strategy: Market movements and external factors may cause investors to question their strategies. However, sticking to the established strategy and avoiding hasty decisions leads to successful results in the long term.
Psychology is perhaps one of the most challenging areas of investing. It is possible to gain discipline in this regard and learn to adhere to investment strategies through technical analysis courses.
What Are the Risks of Investing with Technical Analysis?
While technical analysis can help develop an effective investment strategy, it does not always yield accurate results. One of the biggest risks for investors is the market's excessive volatility in the face of unexpected events. For instance, sudden news flow, economic data, or global events can lead to price movements that technical analysis cannot predict. Therefore, it is important to gain awareness of risks by learning technical analysis through proper training.
Educated investors manage risks better and develop strategic approaches rather than making emotional decisions. For this reason, choosing reliable training is a crucial step to succeeding in the investment world.

