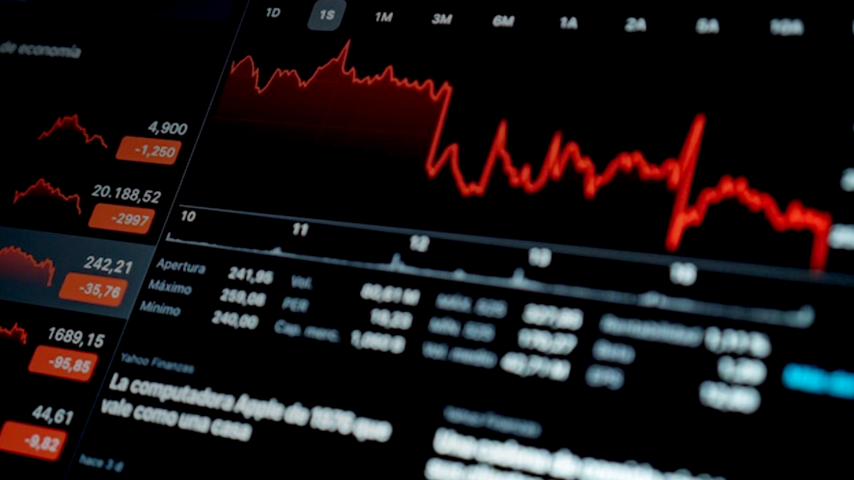
Strategic Technical Analysis

Is it better to trade a lot or trade profitably? How do I get a sense of the big picture? This guide will help you change your mind.

Technical Analysis
Turkish
TRY 1,329.86

5 hour 10 minute total time
Lifetime access
Watch on all platforms

Acquirements

  • The investor will learn when to enter and when to exit the market.
  • What it means to look at the big picture rather than the small and tedious trades.
  • Being involved in high-yielding moves through trend analysis.
  • Staying calm in fluctuations with a wider and tactical perspective.
  • To be able to make unambiguous assessments utilizing basic and numbered indicators.
  • Understanding and accurately reading candlesticks.
  • Performing trend analysis to detect the end or beginning of a trend.

Description

Many people in financial markets are interested in and passionate about technical analysis. The primary reason is that visual graphics are basic and focused on short-term results. As a result, technical analysis is more appealing than financial analysis, which is primarily mathematical.

However, how effective is technical analysis among investors today? The most typical problem is when traders get caught up in short-term intraday charts and lose sight of the big picture. Furthermore, they are unaware of how exhausting the intraday charts are. In reality, the most important thing to see and remember is to look at the big picture and plan a strategy accordingly. Because although short-term charts have limited returns, technical tactics focused on the broad view and based on trend analysis have significantly higher returns.

While investments lost in the small picture and intraday charts attempt to generate a return by making tens of hundreds of transactions, investors who see the key trends and the big picture can achieve far more than the same return with only a few non-weary transactions.

Furthermore, candlestick charts could be more understood and utilized correctly. Candlestick charts, on the other hand, convey messages. It might signal the end or beginning of a significant trend. The simplest and most common candlestick chart formations can provide significant benefits.

This course will keep the investor from making unneeded and exhausting market transactions. It aims to help investors recognize patterns and big pictures rather than getting lost in details. Instead of becoming buried in multiple indicators, only a few indicators and candlestick charts were combined, and a simple narrative was created so that investors could see the messages given by the charts.

Tutors

Tuncay Turşucu
Tuncay Turşucu
Mathematical Engineer and Financial Analyst

Course Content

7 chapters21 videos5 hour 10 minute total time
Introduction
  • Introduction06:00
Technical Chart Types
  • What is Technical Analysis?09:46
  • Technical Analysis Types03:43
Trends
  • Upward Trend21:08
  • Downward Trend10:30
  • Horizontal Trend17:53
Moving Averages
  • Moving Averages29:11
MACD and RSI Indicators
  • Dancing with MACD14:45
  • MACD Synchronization with Stock Price and Examples22:52
  • Dancing with RSI22:51
  • Small Picture or Big Picture?11:09
  • Practice16:40
Candlestick Chart Patterns
  • Candlestick Chart Patterns05:33
  • Candlestick Charts and Single Candlestick Patterns17:21
  • Single Candlestick Pattern Practices24:47
  • Multiple Formations: Harami Pattern26:59
  • Engulfing Pattern07:12
  • Delen Formasyon11:01
  • Morning Star Pattern and The Evening Star Pattern15:54
  • Double Down and Double Top07:25
Closing Remark
  • Closing Remark07:13

Related Courses

TRY 1,329.86

5 hour 10 minute total time
Lifetime access
Watch on all platforms