Review the Financials as Soon as They Are Announced
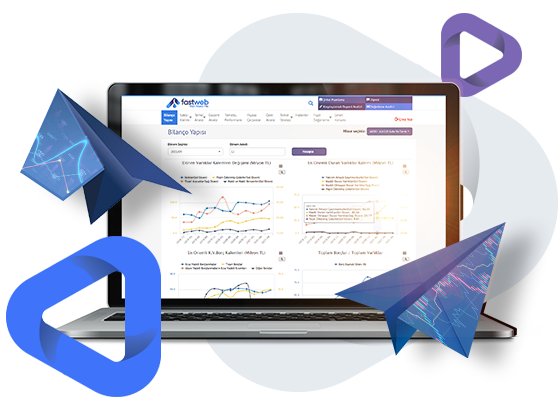
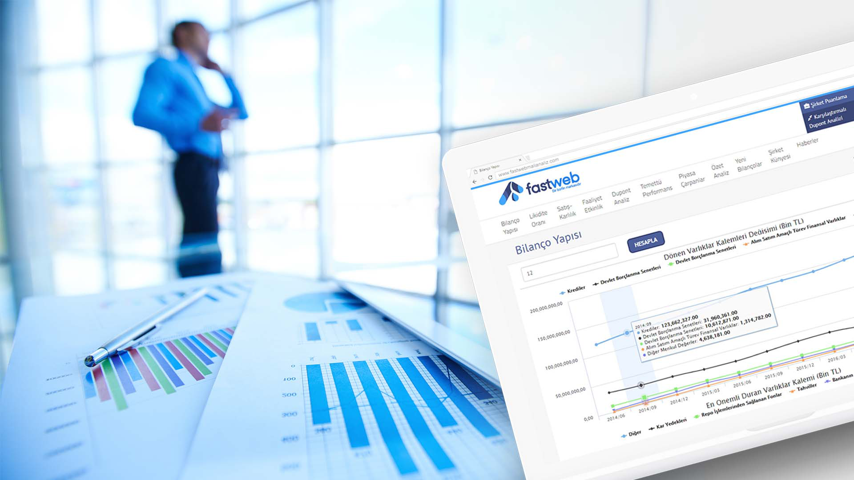
You can access the balance sheets containing all the data you need to examine companies as soon as they are shared. You can review the most commonly used items in balance sheet analysis on colored graphs. With the option for periodical comparison, you can view all balance sheet data in one place and monitor the development of companies.
Reach Informed Decisions through Analysis
With the "Bring Analysis" feature, you can quickly and easily perform equity ratio analysis, horizontal analysis, vertical analysis, trend analysis, and DuPont analysis, and compare performances with periodical comparisons. You can identify prominent players and stable companies in investments and enhance your strategies professionally. You can thoroughly examine all analyses through specially designed dynamic reporting screens or export them to Excel.
Gain with Your Own Predictions
Using prepared financial ratios, you can measure the average annual sales growth, net profit margin, EBITDA margin, and operating margin of selected companies, comparing their historical price and valuation performance. Based on your expectations for future years, you can make forward-looking price predictions and valuations.


